BTFD strategy [3min]Hello
I would like to introduce a very simple strategy to buy lows and sell with minimal profit
This strategy works very well in the markets when there is no clear trend and in other words, the trend going sideways
this strategy works very well for stable financial markets like spx500, nasdaq100 and dow jones 30
two indicators were used to determine the best time to enter the market:
volume + rsi values
volume is usually the number of stocks or contracts traded over a certain period of time. Thus, it is an important indicator of market activity and liquidity. Each transaction constitutes an individual exchange between the buyer and the seller and constitutes the trading volume of a given instrument or asset.
The RSI measures the strength of uptrends versus downtrends. The signal is the entry or exit of the indicator value of the oversold or overbought level of the market. It is assumed that a value below or equal 30 indicates an oversold level of the market, and an RSI value above or equal 70 indicates an overbought level.
the strategy uses a maximum of 5 market entries after each candle that meets the condition
uses 5 target point levels to close the position:
tp1= 0.4%
tp2= 0.6%
tp3= 0.8%
tp4= 1.0%
tp5= 1.2%
after reaching a given profit value, a piece of the position is cut off gradually, where tp5 closes 100% of the remaining position
each time you enter a position, a stop loss of 5.0% is set, which is quite a high value, however, when buying each, sometimes very active downward price movement, you need a lot of space for market decisions in which direction it wants to go
to determine the level of stop loss and target point I used a piece of code by RafaelZioni , here is the script from which a piece of code was taken
this strategy is used for automation, however, I would recommend brokers that have the lowest commission values when opening and closing positions, because the strategy generates very high commission costs
Enjoy and trade safe ;)
Pesquisar nos scripts por "the script"

D-BoT Alpha 'Short' SMA and RSI StrategyDostlar selamlar,
İşte son derece basit ama etkili ve hızlı, HTF de çok iyi sonuçlar veren bir strateji daha, hepinize bol kazançlar dilerim ...
Nedir, Nasıl Çalışır:
Strateji, iki ana girdiye dayanır: SMA ve RSI. SMA hesaplama aralığı 200 olarak, RSI ise 14 olarak ayarlanmıştır. Bu değerler, kullanıcı tercihlerine veya geriye dönük test sonuçlarına göre ayarlanabilir.
Strateji, iki koşul karşılandığında bir short sinyali oluşturur: RSI değeri, belirlenen bir giriş seviyesini (burada 51 olarak belirlenmiş) aşar ve kapanış fiyatı SMA değerinin altındadır.
Strateji, kısa pozisyonu üç durumda kapatır: Kapanış fiyatı, takip eden durdurma seviyesinden (pozisyon açıldığından beri en düşük kapanış olarak belirlenmiştir) büyükse, RSI değeri belirlenen bir durdurma seviyesini (bu durumda 54) aşarsa veya RSI değeri belirli bir kar al seviyesinin (bu durumda 32) altına düşerse.
Güçlü Yönleri:
İki farklı gösterge (SMA ve RSI) kullanımı, yalnızca birini kullanmaktan daha sağlam bir sinyal sağlayabilir.
Strateji, karları korumaya ve fiyat dalgalanmalarında kayıpları sınırlamaya yardımcı olabilecek bir iz süren durdurma seviyesi içerir.
Script oldukça anlaşılır ve değiştirmesi nispeten kolaydır.
Zayıf Yönleri:
Strateji, hacim, oynaklık veya daha geniş piyasa eğilimleri gibi diğer potansiyel önemli faktörleri göz önünde bulundurmaz.
RSI seviyeleri ve SMA süresi için belirli parametreler sabittir ve tüm piyasa koşulları veya zaman aralıkları için optimal olmayabilir.
Strateji oldukça basittir. Trade maliyetini (kayma veya komisyonlar gibi) hesaba katmaz, bu da trade performansını önemli ölçüde etkileyebilir.
Bu Stratejiyle Nasıl İşlem Yapılır:
Strateji, short işlemler için tasarlanmıştır. RSI, 51'in üzerine çıktığında ve kapanış fiyatı 200 periyotluk SMA'nın altında olduğunda işleme girer. RSI, 54'ün üzerine çıktığında veya 32'nin altına düştüğünde veya fiyat, pozisyon açıldığından beri en düşük kapanış fiyatının üzerine çıktığında işlemi kapatır.
Lütfen Dikkat, bu strateji veya herhangi bir strateji izole bir şekilde kullanılmamalıdır. Tüm bu çalışmalar eğitsel amaçlıdır. Yatırım tavsiyesi içermez.
This script defines a trading strategy based on Simple Moving Average (SMA) and the Relative Strength Index (RSI) indicators. Here's an overview of how it works, along with its strengths and weaknesses, and how to trade using this strategy:
How it works:
The strategy involves two key inputs: SMA and RSI. The SMA length is set to 200, and the RSI length is set to 14. These values can be adjusted based on user preferences or back-testing results.
The strategy generates a short signal when two conditions are met: The RSI value crosses over a defined entry level (set at 51 here), and the closing price is below the SMA value.
When a short signal is generated, the strategy opens a short position.
The strategy closes the short position under three conditions: If the close price is greater than the trailing stop (which is set as the lowest close since the position opened), if the RSI value exceeds a defined stop level (54 in this case), or if the RSI value drops below a certain take-profit level (32 in this case).
Strengths:
The use of two different indicators (SMA and RSI) can provide a more robust signal than using just one.
The strategy includes a trailing stop, which can help to protect profits and limit losses as the price fluctuates.
The script is straightforward and relatively easy to understand and modify.
Weaknesses:
The strategy doesn't consider other potentially important factors, such as volume, volatility, or broader market trends.
The specific parameters for the RSI levels and SMA length are hard-coded, and may not be optimal for all market conditions or timeframes.
The strategy is very simplistic. It doesn't take into account the cost of trading (like slippage or commissions), which can significantly impact trading performance.
How to trade with this strategy:
The strategy is designed for short trades. It enters a trade when the RSI crosses above 51 and the closing price is below the 200-period SMA. It will exit the trade when the RSI goes above 54 or falls below 32, or when the price rises above the lowest closing price since the position was opened.
Please note, this strategy or any strategy should not be used in isolation. It's important to consider other aspects of trading such as risk management, capital allocation, and combining different strategies to diversify. Back-testing the strategy on historical data and demo trading before going live is also a recommended practice.

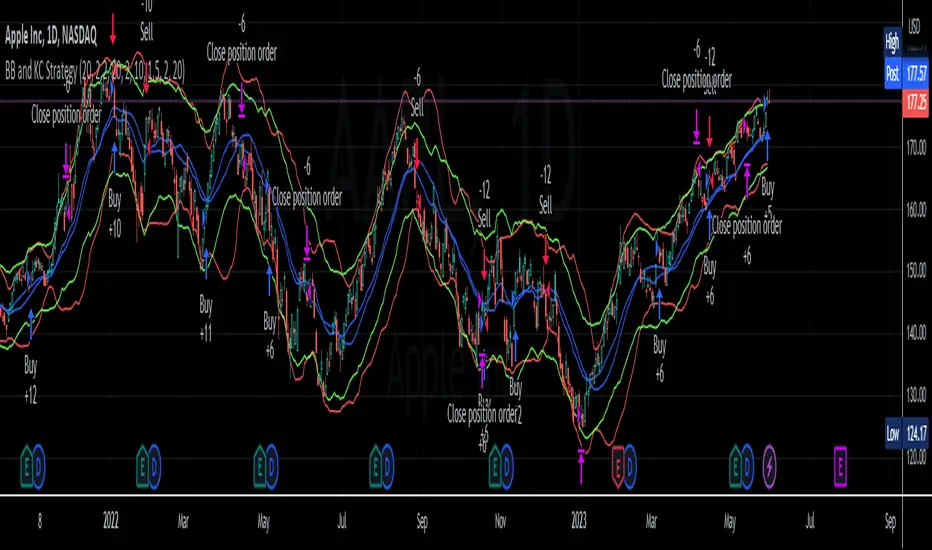
BB and KC StrategyThis script is designed as a TradingView strategy that uses Bollinger Bands (BB) and Keltner Channels (KC) as the primary indicators for generating trade signals. It aims to catch potential market trends by comparing the movements of these two popular volatility measures.
Key aspects of this strategy:
1. **Bollinger Bands and Keltner Channels:** Both are volatility-based indicators. The Bollinger Bands consist of a middle band (simple moving average) and two outer bands calculated based on standard deviation, which adjusts itself to market conditions. Keltner Channels are a set of bands placed above and below an exponential moving average of the price. The distance between the bands is calculated based on the Average True Range (ATR), a measure of price volatility.
2. **Entry Signals:** The strategy enters a long position when the upper KC line crosses above the upper BB line and the volume is above its moving average. Conversely, it enters a short position when the lower KC line crosses below the lower BB line and the volume is above its moving average.
3. **Exit Signals:** The strategy exits a position under two conditions. First, if the trade has been open for a certain number of bars defined by the user (default 20 bars). Second, a stop loss and trailing stop are in place to limit potential losses and lock in profits as the price moves favorably. The stop loss is set at a percentage of the entry price (default 1.5% for long and -1.5% for short), and the trailing stop is also a percentage of the entry price (default 2%).
4. **Trade Quantity:** The script allows specifying the investment amount for each trade, set to a default of 1000 currency units.
Remember, this is a strategy script, which means it is used for backtesting and not for real-time signals or live trading. It is also recommended that it is used as a tool to aid your trading, not as a standalone system. As with any strategy, it should be tested over different market conditions and used in conjunction with other aspects of technical and fundamental analysis to ensure robustness and effectiveness.
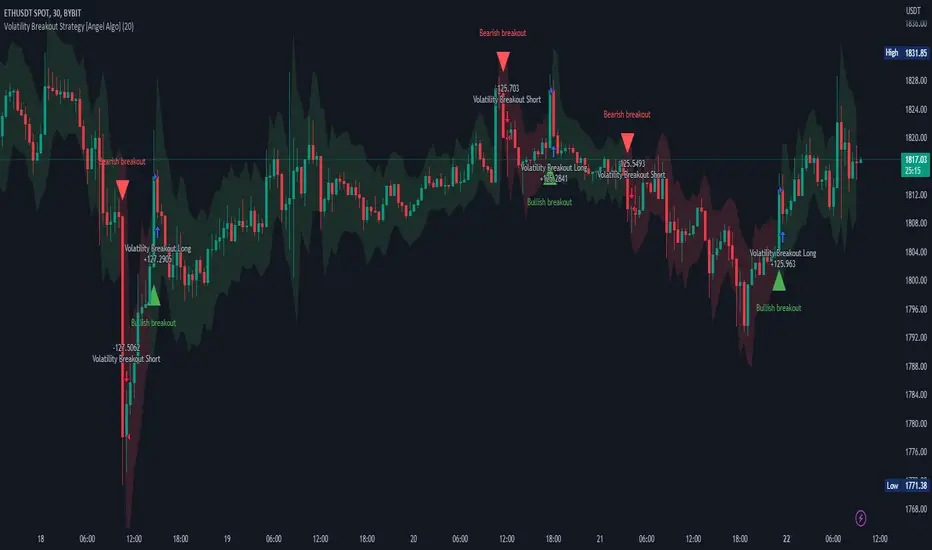
Volatility Breakout Strategy [Angel Algo]As traders, we're always looking for opportunities to profit from sudden price breakouts, and the Volatility Breakout Strategy aims to do just that.
This script is the perfect starting point for traders who want to experiment with capturing price movements resulting from increased volatility. The script plots the Average True Range (ATR) on the chart, which is a measure of the asset's volatility over a specified period. By setting the "Length" parameter, you can customize the period over which the volatility is measured.
Using the ATR, the strategy calculates upper and lower breakout levels and plots them on the chart. The signals for long and short positions are generated when the price crosses above the upper breakout level or below the lower breakout level, respectively. They are confirmed by checking the current bar state.
The strategy also fills the space between the upper and lower breakout levels with a color that indicates the latest signal direction. This feature helps traders quickly identify the prevailing trend.
The strategy uses the generated signals to enter trades. When a long or short signal is confirmed, and there is no open position in the direction of the signal, the strategy enters a long or short trade, respectively.
Choice of parameters.
Choosing the right value for the Length input parameter is crucial for tailoring the Volatility Breakout Strategy to suit your trading preferences. In general, a higher Length value implies a focus on capturing longer price moves. For instance, in this script, we have set the Length value to 20, resulting in trades that span approximately 100 candles. These trades encompass price trends consisting of multiple swings.
However, if your goal is to trade individual swings rather than longer trends, it's advisable to experiment with smaller values for the Length parameter. By reducing the Length, you can target shorter-term price movements and potentially increase the frequency of trades.
It's important to note that while a higher Length value tends to lead to longer trades, there is no strict correlation between the Length parameter and the average length of trades. This can vary across different markets. Therefore, it's essential to conduct thorough experimentation with various Length values and closely observe the length of trades they generate. Comparing these trade lengths with the average trend or swing length in the specific market can provide valuable insights.
Ideally, you should aim to select a Length value that aligns with the average trend or swing length observed in the market you are trading. This way, you can optimize the strategy to capture price movements that closely match the prevailing market conditions.
Remember, finding the optimal Length value is a process of trial and error, combined with careful observation of trade lengths and their correlation with market trends. So, don't be afraid to experiment and refine the Length parameter to maximize the effectiveness of the Volatility Breakout Strategy in your chosen market.
Disclaimer: This trading strategy is provided for educational and informational purposes only.Trading involves risk, and past performance is not indicative of future results.
DCA Simulator A simple yet powerful Dollar Cost Averaging (DCA) simulator.
You just add the script to your chart, and you'll be able to see:
- Every single entry with its size
- The evolution of you average price in time (blue line)
- The profit and loss areas (where market price < average price the DCA is at loss, and the background is colored in red. At the contrary, where mkt price is > average price, it's profit area and the background is green).
- Max drawdown: the point in price and time where the DCA loss is maximum in the considered time interval. The drawdown amount is specified.
- Profit (or loss) and total cost at the end of the time interval or at the present day: the script shows how much the DCA is netting at a profit or loss, as well as the total cost of the DCA itself.
The parameters are:
- Date start and date end: time interval of the DCA simulation
- DCA period (you can choose between daily, weekly and monthly)
- Week day or month day if you choose those periods
- Single operation size (in base currency)
- Option to choose a DCA LONG or DCA SHORT (for uber bears)
- Option to include an exit strategy that partially closes your position (the % size closed can be chosen as well with the parameter "exit_close_perc") every time the DCA realizes a specific gain (choosable with the parameter "exit_gain_threshold"). If you choose "none" as an exit strategy, the script will assume to never close positions until the end of the period or the present day for simulation purpose.
NB: just ignore the TV strategy tester results, all the data are visible on the chart.

Ichimoku Cloud and ADX with Trailing Stop Loss (by Coinrule)The Ichimoku Cloud is a collection of technical indicators that show support and resistance levels, as well as momentum and trend direction. It does this by taking multiple averages and plotting them on a chart. It also uses these figures to compute a “cloud” that attempts to forecast where the price may find support or resistance in the future.
The Ichimoku Cloud was developed by Goichi Hosoda, a Japanese journalist, and published in the late 1960s. It provides more data points than the standard candlestick chart. While it seems complicated at first glance, those familiar with how to read the charts often find it easy to understand with well-defined trading signals.
The Ichimoku Cloud is composed of five lines or calculations, two of which comprise a cloud where the difference between the two lines is shaded in.
The lines include a nine-period average, a 26-period average, an average of those two averages, a 52-period average, and a lagging closing price line.
The cloud is a key part of the indicator. When the price is below the cloud, the trend is down. When the price is above the cloud, the trend is up.
The above trend signals are strengthened if the cloud is moving in the same direction as the price. For example, during an uptrend, the top of the cloud is moving up, or during a downtrend, the bottom of the cloud is moving down.
DMI is simple to interpret. When +DI > - DI, it means the price is trending up. On the other hand, when -DI > +DI , the trend is weak or moving on the downside. The ADX does not give an indication about the direction but about the strength of the trend.
Typically values of ADX above 25 mean that the trend is steeply moving up or down, based on the -DI and +D positioning. This script aims to capture swings in the DMI, and thus, in the trend of the asset, using a contrarian approach.
Trading on high values of ADX, the strategy tries to spot extremely oversold and overbought conditions. Values of ADX above 45 may suggest that the trend has overextended and is may be about to reverse.
This strategy combines the Ichimoku Cloud with the ADX indicator to better enter trades.
Long orders are placed when these basic signals are triggered.
Long Position:
Tenkan-Sen is above the Kijun-Sen
Chikou-Span is above the close of 26 bars ago
Close is above the Kumo Cloud
MACD line crosses over the signal line
-DI is greater than +DI
ADX is greater than 45
Close Position:
3% increase trailing
3% decrease trailing
The script is backtested from 1 January 2018 and provides good returns.
The strategy assumes each order is using 30% of the available coins to make the results more realistic and to simulate you only ran this strategy on 30% of your holdings. A trading fee of 0.1% is also taken into account and is aligned to the base fee applied on Binance.
This script also works well on MATIC (1d timeframe), ETH (1d timeframe), and SOL (1d timeframe).

[XRP][1h] Chanu Delta inspired — Breakeven StrategyHello, this is my first TV contribution. I usually don't publish anything but the script is a quick review of an other contributor (Chanu Delta V3 script )
I reverse engineered this indicator today as I wanted to test it on other contracts. The original version (which aims to be traded on BTC) has been ported to XRP (as btc and xrp prices are narrowly correlated) then modified with a couple of what I believe are improvements:
- No backtest bias even with `security` function.
- Extra backtest bias validation, always trading on next bar as Crossover/under bias is confirmed
- Backtest with 2 ajustable TP, ajustable equity and breakeven option
- The current version is not design to use pyramiding as it would require extra logic to monitor the lifecycle of the position in the context of a study.
- Commented alerts examples with variables available in script scope so you can use them in alerts (just replace strategy with indicator and remove backtest related code block).
- Trade filling assumption set to 10, fees to 0.02 as the are default bybit maker fees and I advice to enter with trailing orders using a max of 2 ticks as offset to lower fees rather than a market order!
- Backtest and Alerts happen on barclose.
- No repaint guaranteed.
There are a thousand ways to improve it (adx/bb based dynamic TP/SL, order lifecycle, pyramiding...) but it seems to be a cool starting point.
Don't forget to have fun!

MTF Supertrend [Trading Nerd]Trend Trading Strategy using Supertrends
Backtesting Script that uses a multitimeframeanalysis of the Supertrend Indicator. The trend direction is determind by a higher Timeframe (TF) Supertrend. The entry Signals are given by the Supertrend of the current TF. The script is NOT repainting (the script takes the previous value of the higher TF Supertrend, if the higher TF candle is not confirmed yet).
Strategy Conditions
Longs:
The higher TF Supertrend has to be green
The current TF Supertrend change from red to green
Shorts:
The higher TF Supertrend has to be red
The current TF Supertrend change from green to red
Optional:
Option: If enabled also a trend chage of the higher TF Supertrend is a valid Entry Signal
If enabled Signals are discarded if the ADX is below the value
Take Profit
On default there is no Take Profit. You can activate a Risk Reward Based Take Profit target trough the option. Also a Partial Take Profit is possible.
Stop Loss
The default Stop Loss Strategy is a Trailing Stoploss. As trailing Price the current TF Supertrend is used.
Additional
Time Filter: Only opens trade in the defined Session. Open trades are still being closed outside of the Session.
Start Date/End Date: Limits the backtest for the defined Date Range
Trading Days: Only open Trades on the checked Days
Risk % per Trade: If enabled the Strategy uses X% of the capital (defined in Settings -> Properties -> Initial Capital)
Use Compound Interest: If enabled Capital is recalculated for every trade (initial capital + net Profit)
IMPORTANT: For low Timeframes and Markets with tight SL (like Forex) it requires a lower Margin Percent than default. Go to Settings->Properties and lower the required Long/Short Margin. Otherwise Trades might not be considered because of too less capital/marign. Margins can e.g. set to: 2% (Forex), 10% (Stocks), 20% (Crypto).

BT-SAR Ema, Squeeze, Volatility
Esse script foi criado para estudo de Backtest.
Ele usa o SAR PARABÓLICO como indicador de sinal de entrada, você também pode combinar 3 indicadores para filtrar as entradas: Média Móvel, Squeeze Momentum e Volatility Oscilator .
Existe duas entradas, quando o SAR Parabólico vira ou pelo Breakout (usando o último preço) do SAR Parabólico antes dele virar.
As Os filtros podem ser usados de forma combinada ou individual.
O Script também pode ser usado com algum serviço de bot como 3commas.io, basta colocar as mensagens de entrada e saída para o bot.
This script was created for Backtest study.
It uses PARABOLIC SAR as input signal indicator, you can also combine 3 indicators to filter inputs: Moving Average, Squeeze Momentum and Volatility Oscillator .
There are two entries, when the Parabolic SAR turns or by Breakout (using the last price) of the Parabolic SAR before it turns.
The Filters can be used in combination or individually.
The Script can also be used with some bot service like 3commas.io, just put the input and output messages to the bot.

Ichimoku Cloud with ADX (By Coinrule)The Ichimoku Cloud is a collection of technical indicators that show support and resistance levels, as well as momentum and trend direction. It does this by taking multiple averages and plotting them on a chart. It also uses these figures to compute a “cloud” that attempts to forecast where the price may find support or resistance in the future.
The Ichimoku Cloud was developed by Goichi Hosoda, a Japanese journalist, and published in the late 1960s. It provides more data points than the standard candlestick chart. While it seems complicated at first glance, those familiar with how to read the charts often find it easy to understand with well-defined trading signals.
The Ichimoku Cloud is composed of five lines or calculations, two of which comprise a cloud where the difference between the two lines is shaded in.
The lines include a nine-period average, a 26-period average, an average of those two averages, a 52-period average, and a lagging closing price line.
The cloud is a key part of the indicator. When the price is below the cloud, the trend is down. When the price is above the cloud, the trend is up.
The above trend signals are strengthened if the cloud is moving in the same direction as the price. For example, during an uptrend, the top of the cloud is moving up, or during a downtrend, the bottom of the cloud is moving down.
DMI is simple to interpret. When +DI > - DI, it means the price is trending up. On the other hand, when -DI > +DI , the trend is weak or moving on the downside. The ADX does not give an indication about the direction but about the strength of the trend.
Typically values of ADX above 25 mean that the trend is steeply moving up or down, based on the -DI and +D positioning. This script aims to capture swings in the DMI, and thus, in the trend of the asset, using a contrarian approach.
Trading on high values of ADX , the strategy tries to spot extremely oversold and overbought conditions. Values of ADX above 45 may suggest that the trend has overextended and is may be about to reverse.
This strategy combines the Ichimoku Cloud with the ADX indicator to better enter trades.
Long/Short orders are placed when these basic signals are triggered.
Long Position:
Tenkan-Sen is above the Kijun-Sen
Chikou-Span is above the close of 26 bars ago
Close is above the Kumo Cloud
MACD line crosses over the signal line
-DI is greater than +DI
ADX is greater than 45
Short Position:
Tenkan-Sen is below the Kijun-Sen
Chikou-Span is below the close of 26 bars ago
Close is below the Kumo Cloud
MACD line crosses under the signal line
+DI is greater than -DI
ADX is less than 45
The script is backtested from 1 January 2022 and provides good returns.
The strategy assumes each order is using 30% of the available coins to make the results more realistic and to simulate you only ran this strategy on 30% of your holdings. A trading fee of 0.1% is also taken into account and is aligned to the base fee applied on Binance.
This script also works well on MATIC (15m timeframe), ETH (5m timeframe), and SOL (15m timeframe).

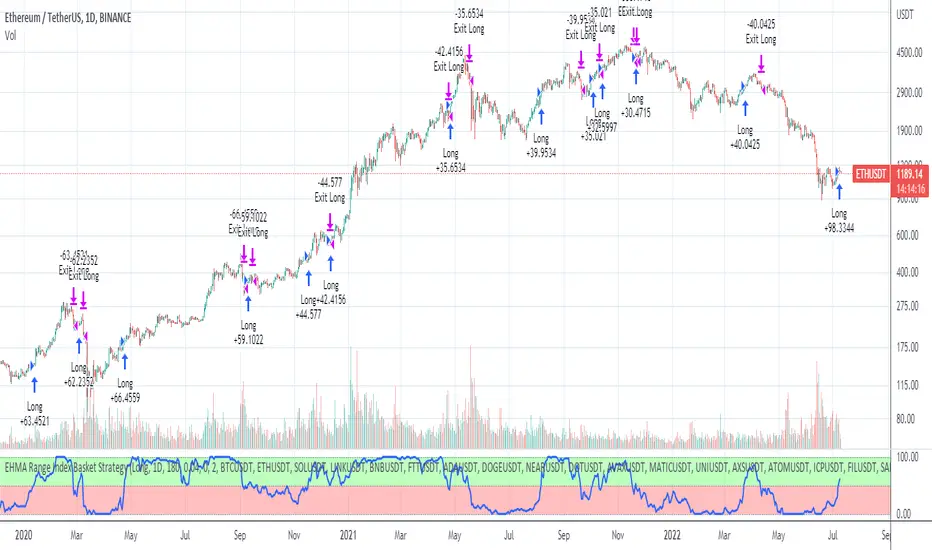
EHMA Range Index Basket StrategyThis script is a modified version of my EHMA Range Strategy.
EHMA Range Strategy
In addition to the EHMA, this script works with a range around the EHMA (which can be modified), in an attempt to be robust against fake signals. Many times a bar will close below a moving average, only to reverse again the next bar, which eats away at your profits. Especially on shorter timeframes, but also on choppy longer timeframes this can make a strategy unattractive to use.
With the range around the EHMA, the strategy only enters a long/exit-short position if a bar crosses above the upper range. Vice versa, it only enters a short/exit-long position if a bar crosses below the lower range. This avoids positions if bars behave choppy within the EHMA range & only enters a position if the market is confident in it's direction. Having said that, fakeouts are still possible, but a lot less frequent. Having backtested this strategy vs the regular EHMA strategy (and having experimented with various settings), this version seems to be a lot more robust & profitable!
EHMA Range Index Basket Strategy
The EHMA Range Index Basket Strategy aims to make the EHMA Range Strategy even more robust, by taking nearly 40 of the most traded crypto trading pairs and applying the EHMA Range Strategy to them. For each pair it assigns a 0 (Sell signal) or 1 (Buy signal) and adds them up. If the number of Buy signals outweigh the number of Sell signals, the index strategy triggers its Buy signal (and vice versa). The results are even more profitable & robust than with the EHMA Range Strategy on its own. Next to that, it performs a lot better on most crypto pairs, due to it's robustness. Because of that, this strategy is a lot less prone to overfitting and will likely produce better results during live trading conditions!
Disclaimer
Please remember that past performance may not be indicative of future results.
Due to various factors, including changing market conditions, the strategy may no longer perform as good as in historical backtesting.
This post and the script don’t provide any financial advice.
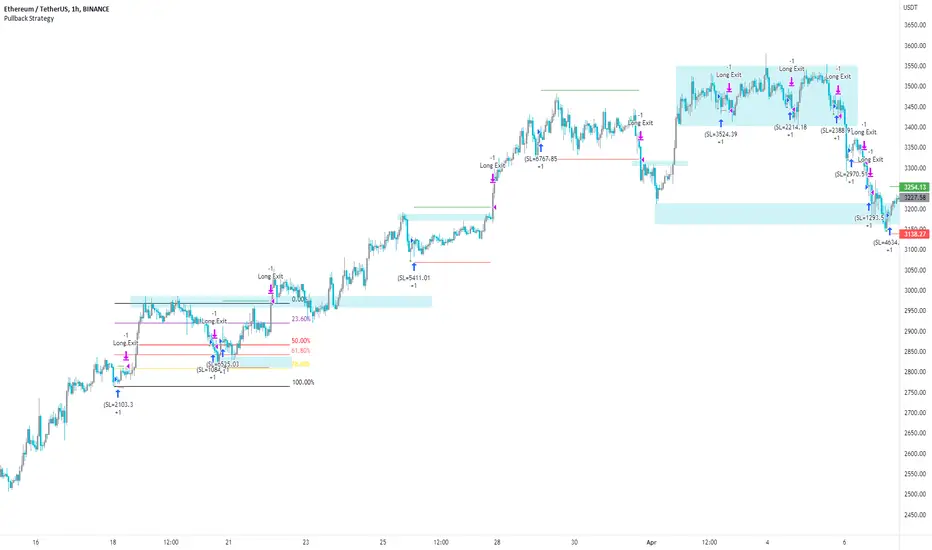
Pullback Strategy (Candle Analysis) New VersionFollowing on from the previous Pullback Candle which smashed over 100 likes - here we have the strategy behind the indicator.
Signal = Pullback Candle (This will alert on all timeframes and markets when selecting the Alert function for the Signal
Entry = When the Pullback Candle is confirmed ie 16:00 - the strategy will enter within the next two candles.
Stop loss = 0.25 ATR multiple which means we have a tighter stop loss - if greater than 1 then the stop loss will be more in percentages!!!
Take Profit = 1.5 Risk to Reward Model
Ema filter - There is a function to modify when looking into trades so as this is a bullish setup we want trades to be over the ema and using this filter will only show trades above the 200ema
Time filter - If you want to backtest Uptrends - locate the time of the start and the end of the uptrend - input this data into the settings and this will bring up the trades in that time period.
Most efficient to use this script is only in uptrends and this signal is a bullish signal - when using a ema filter we wont get trades under this so narrow down good trades for automation.
!!!!TO ENHANCE THE SYSTEM - USE TECHNICAL ANANLYSIS FOR CONFLUENCES
Most inefficient way to use the script is when price is in a downtrend and the win rate falls dramatically.
The pullback candle has a R-Expectancy of R5 so profits can be elongated when trading manually.
As the pullback candle occurs often in a trend we could pyramided trades to say have 5 trades in the same direction but the way i would trade this is to alert R1.5 then look to R2 and above to take profits manually.
(((P.S coders.... i need help to work on a profit extension code where exit long when price is below the 9ema (this seems simple but proving difficult) - this would be included onto the script if received.
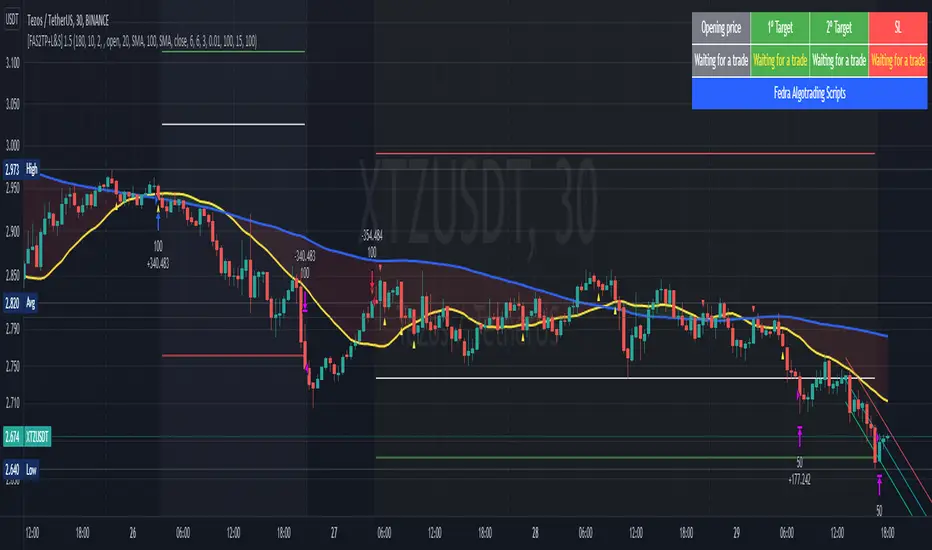
[Fedra Algotrading Strategy 2tp+L&S] Futures Long or ShortStrategy for crypto market, designed for automatic algorithmic trading with bots.
Can place long and short orders
Calculates your entries based on the breakout of the simple deviation of the linear regression of the last X periods.
Configures TP (green line) and SL (red line) percentages, the TP is a trailing TP.
Optionally, you can set a first TP (white line) that sells half of the position.
Advanced trend filter to not open trades against the market. SMA (yellow line), WMA (blue line) and secret sauce
Includes an advanced system to control the backtest period (choose how many days to backtest).
Risk management by volume of capital or amount of losing trades (kill switches that will exit the trade and stop the script)
The script includes default commissions of 0.2% per trade (configurable).
- Dinamic table with Price positions to plan your limit orders if you are trading manually
- Highly customizable and optimizable.
If you want to trade longs and shorts, it is advisable to create 2 different alerts. In most cases, the optimal parameters for longs are not the same as for shorts. In a forthcoming update I will enable separate configurations.
For better performance the script uses real time price information, for this reason Tradingview may warn you that there is "repainting", as the backtest information does not contain the information of each tick but only the open, close, high and low values of each candle.
To avoid this, you can disable the "calculate on every tick" option from the strategy settings panel.
Ultimate Strategy Shell [ArtK]This strategy shell script accepts entry/exit signals from an external study indicator.
It is built to cover most common trade execution strategies such as, multiple take profit levels, break even, trailing stop loss, position reverse, laddering and more.
It also aims to provide extended trade statistics such as the actual (win/loss) figures for trades instead of figures for orders as TradingView provides in the Strategy Test Overview.
Features
- 3 Take Profit levels.
- 3 Take Profit target type options (Percentage, Risk Reward Ratio or (IN DEVELOP) Strategy).
- 2 Stop Loss type options (Percentage, Strategy).
- Break Even stoop loss (will move the Stop Loss to the entry price after the 1st or 2nd Take Profit).
- Trailing Stop Loss (will move the Stop Loss after the last Take Profit at specified deviation on every candle).
- Trades Summary Label
Shows the number of wins and losses in a row.
Shows the actual (win/loss) figures for trades instead of figures for orders as TradingView provides in the Strategy Test Overview.
Shows the period from the first trade until the last trade.
Shows how many times each Take Profit level was reached (IN DEVELOP).
(IN DEVELOP) Shows the maximum Stop Loss when using the Stop Loss – Strategy option (helpful when estimating Stop Losses when leveraging).
Plots marks at the bottom of the chart to indicate winning or losing trades (helps to quickly find losing trades for example).
- Entry Filters
-- Date Time, allows placing trades only during the specified period.
-- ADX, filters trades below specified ADX value.
-- Max Stop Loss, can be enabled when the Stop Loss type is set to "Strategy". Used to prevent taking trades which exceed liquidation price.
-- Direction, will filter trades in a certain direction.
Instruction
- The strategy script relies on an external indicator therefore it is required to add the signal indicator first.
- To adapt the signal indicator to be compatible it must have only one plot.
-- The default value of the plot should be 1 when there is no buy/sell signal.
-- When the signal indicator signals BUY the line should plot the value
-- When the signal indicator signals SELL the line should plot the value
-- (I am aiming to support EXIT signals as well as the Stop Loss and Take Profit percentages in the near future)
- The first time you load the script it will show an error "Study Error: Signal source set to default ". This means the signal indicator was not selected.
The signal indicator should be selected in the strategy configuration panel option "Signal Source"

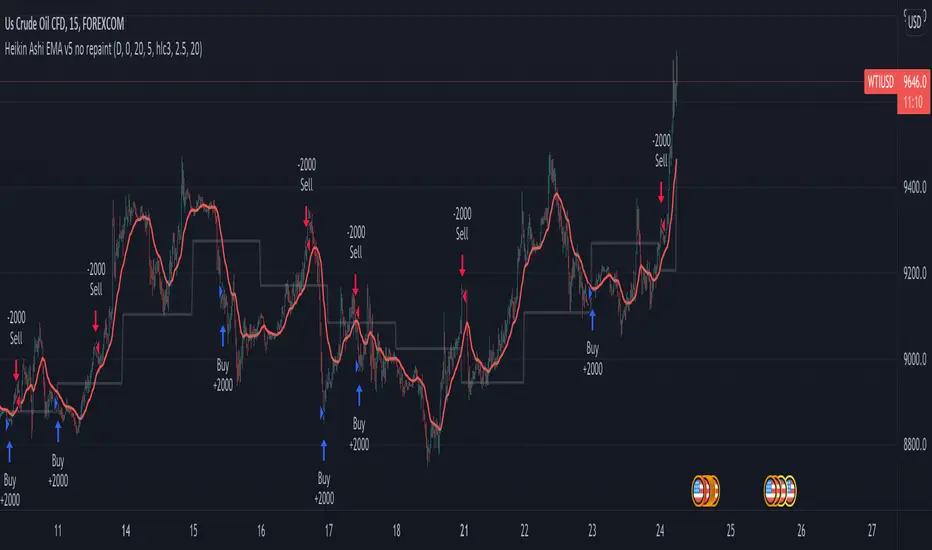
Heikin Ashi EMA v5 no repaint This script was inspired by the "Heikin/Kaufman Strategy" from marco valente built on v2.
The script was rebuilt on the v5 and most importantly removed the repaint function that was driving surrealistic backtesting inflated numbers.
This script is now fully functional and not repainting - At the time of testing worked efficiently 90% WR and 2x profit factor on CFD WTI OIL with a 15m time frame indexed on forex.com price.
You should utilize this script with caution, especially on high volatility cycles you can try plotting against a volatility relative index or stop.
I also strongly recommend understanding the fundamentals of WTI OIL to balance the indications of the strategy with fundamentals.
Thanks to Clovis Warlop and Nilesh Sharma for their contribution.
Cheers,
Gustavo Bramao
[cache_that_pass] 1m 15m Function - Weighted Standard DeviationTradingview Community,
As I progress through my journey, I have come to the realization that it is time to give back. This script isn't a life changer, but it has the building blocks for a motivated individual to optimize the parameters and have a production script ready to go.
Credit for the indicator is due to @rumpypumpydumpy
I adapted this indicator to a strategy for crypto markets. 15 minute time frame has worked best for me.
It is a standard deviation script that has 3 important user configured parameters. These 3 things are what the end user should tweak for optimum returns. They are....
1) Lookback Length - I have had luck with it set to 20, but any value from 1-1000 it will accept.
2) stopPer - Stop Loss percentage of each trade
3) takePer - Take Profit percentage of each trade
2 and 3 above are where you will see significant changes in returns by altering them and trying different percentages. An experienced pinescript programmer can take this and build on it even more. If you do, I ask that you please share the script with the community in an open-source fashion.
It also already accounts for the commission percentage of 0.075% that Binance.US uses for people who pay fees with BNB.
How it works...
It calculates a weighted standard deviation of the price for the lookback period set (so 20 candles is default). It recalculates each time a new candle is printed. It trades when price lows crossunder the bottom of that deviation channel, and sells when price highs crossover the top of that deviation channel. It works best in mid to long term sideways channels / Wyckoff accumulation periods.

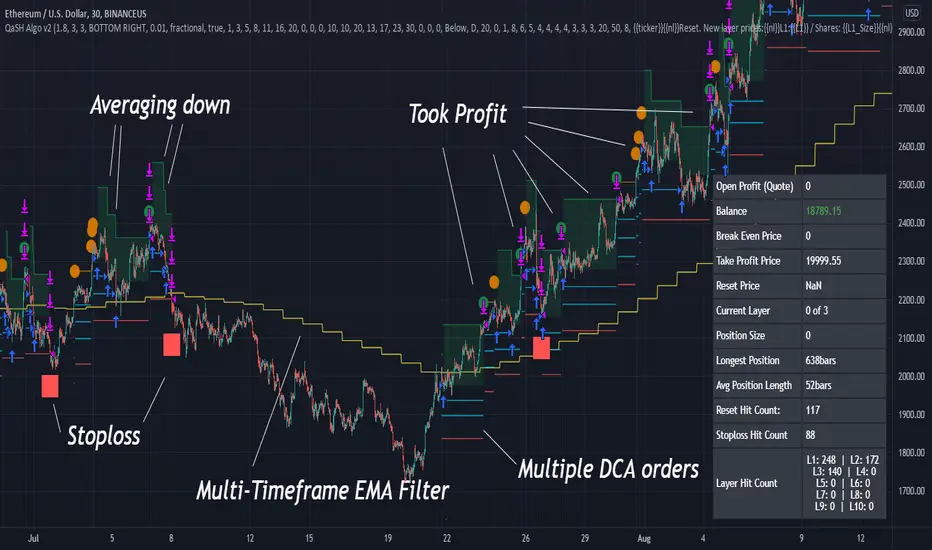
QaSH DCA Algorithm 2.0This is the strategy version of the QaSH DCA Algorithm indicator. This strategy version of the script includes live trading alert functionality, so it can be considered as a replacement that makes the indicator version obsolete. With this version, features have been added and also you can take advantage of TradingView's native backtesting system for more detailed backtest results.
QaSH DCA Algorithm implements a DCA strategy that takes advantage of price volatility by buying dips to average down, and adjusting price targets as the break-even price gets lower.
How does the DCA strategy work?
When the specified entry condition has occurred, the indicator will set up several limit orders below the current price. If price goes up a specified amount, then the layers will be overwritten at the higher prices. If price goes down and fills the first layer (limit order), then the Take Profit price is plotted and will be sent in an alert. If more layers are filled, then the TP price will move down accordingly as it’s based on the average entry price (alerts on each TP update). This action of lowering the average entry and TP price mitigates your risk, and increases the likelihood of a Take Profit event happening. This script uses a simple "ASAP" mode, where each deal will start exactly 2 bars after the last trade ended. An EMA filter and stoploss function was also added for risk management.
How does this differ from other DCA bots?
1) The layer placements, order volume , and “take profit %” for each layer or “safety order” is much more customizable than what you get from other services. For example, I can choose to have my TP% change, depending on how big the price dip was. Maybe on safety order 1 I want 10% TP, but on safety order 7 might want a 2% TP.
2) The entry condition is adjustable. For example, this script has an ema filter for entries.
3) Settings optimization. You can take advantage of the replay feature and TradingView's backtest system to see how trades would have played out, and how much PnL you would have made
4) You can use this indicator on more than just crypto. You can easily set up alerts for manual trades on stocks, or you can integrate it with your stock broker API of choice and automate your trades.
5) When combining this with an automation service, you will get unmatched execution speed by running it on your dedicated machine.
6) I can offer a lifetime subscription to the indicator upon request.
What kind of market is it best used on?
QaSH DCA Algorithm is best used on assets that are volatile. That means large and frequent swings up and down. Also I recommend running this on many uncorrelated assets at the same time. Better yet, run it with a variety of different settings simultaneously on the same asset.
What settings should I use?
The default settings are decent for most markets, and provide a good balance between profit potential and downside protection, although you can use a wide variety of settings. In a strong bull market its best to either bring up your layers to catch smaller dips, or you can go big on the first few layers (maybe 4 layers, 25% on each layer for example). In a sideways or brearish market you'll want more downside protection, so you'll want the larger orders to be at lower prices, or possibly use the stoploss and EMA filter.
Six Factors Ichimoku 1.0This strategy has the purpose to help dummies to get experienced when trade with Crypocurrencies, using the Ichimoku indicator
The following script shows an strategy based on Ichimoku indicator. Taking into account the theoretical concepts of the Ichimoku Kinko Hyo, are defined six (6) factors to open position and two (2) factors to close it. According to the author of the book, in which is based the script, it is stablished that the proper combination of the six factors when the timeframe is set in 1D and the assest Cryptocurrencies (not applicable to stable Coins), has demonstrated in the Backtesting good results.
Althoug is not the purpose, the Ichimoku indicator is composed by six components (Tenkan Line, Kijun Line, Senkou Span A, Senkou Span B and Kumo Cloud) and the relative position of the current price of the assest compared with ichimoku components define these factor.
Factors to open position
Factor one. The current price is over the Ichimoku Cloud
Factor two. When Senkou Span A is greater thant Senkou Span B, proyected 22 periods forward.
Factor three. Senkou Span A, has a positive slope, during the previous periods.
Factor four.The Tenkan Line (quick line) is above the Kijun Line (slow line) during the previous periods.
Factor five. The Chikou Span Line is above the Kumo
Factor six. The slope of the sma (200) is positive.
The long entry is recomended when the following expresion is matched
F1 and F2 and F4 and F5 and (F3 or F6)
Factors to close position
Factor one. Tenkan line has a downward trajectory for previous periods. If the price change during this periods the counter reset and start again trying to prevent exit from quick variations.
Factor two. Current price is below Kijun line
The time to close position is recommended when the following expresión occurs
F1 and F2
Some of the features of the script are the following:
Initial amount of investment stablished on 100€, but can be modified by the user.
User can easily modified the period for backtesting purposes.
"Show factors" give the user and easy interface to know the current status of the strategy`s factors. The factors appears color red (false) and color green (true)
It is possible to cancel Factor F5, which is interesting after the assests has dumped strongly. The color black means that F5 is canceled.
Change the output criteria by F1 or F2 (not recommended) but available for learning purposes.
Auxiliary lines that help to idenfify strong resistances that could compromise the strategy
Enjoy it !!!
Miguel A. Calatayud

(IK) Base Break BuyThis strategy first calculates areas of support (bases), and then enters trades if that support is broken. The idea is to profit off of retracement. Dollar-cost-averaging safety orders are key here. This strategy takes into account a .1% commission, and tests are done with an initial capital of 100.00 USD. This only goes long.
The strategy is highly customizable. I've set the default values to suit ETH/USD 15m. If you're trading this on another ticker or timeframe, make sure to play around with the settings. There is an explanation of each input in the script comments. I found this to be profitable across most 'common sense' values for settings, but tweaking led to some pretty promising results. I leaned more towards high risk/high trade volume.
Always remember though: historical performance is no guarantee of future behavior . Keep settings within your personal risk tolerance, even if it promises better profit. Anyone can write a 100% profitable script if they assume price always eventually goes up.
Check the script comments for more details, but, briefly, you can customize:
-How many bases to keep track of at once
-How those bases are calculated
-What defines a 'base break'
-Order amounts
-Safety order count
-Stop loss
Here's the basic algorithm:
-Identify support.
--Have previous candles found bottoms in the same area of the current candle bottom?
--Is this support unique enough from other areas of support?
-Determine if support is broken.
--Has the price crossed under support quickly and with certainty?
-Enter trade with a percentage of initial capital.
-Execute safety orders if price continues to drop.
-Exit trade at profit target or stop loss.
Take profit is dynamic and calculated on order entry. The bigger the 'break', the higher your take profit percentage. This target percentage is based on average position size, so as safety orders are filled, and average position size comes down, the target profit becomes easier to reach.
Stop loss can be calculated one of two ways, either a static level based on initial entry, or a dynamic level based on average position size. If you use the latter (default), be aware, your real losses will be greater than your stated stop loss percentage . For example:
-stop loss = 15%, capital = 100.00, safety order threshold = 10%
-you buy $50 worth of shares at $1 - price average is $1
-you safety $25 worth of shares at $0.9 - price average is $0.966
-you safety $25 worth of shares at $0.8. - price average is $0.925
-you get stopped out at 0.925 * (1-.15) = $0.78625, and you're left with $78.62.
This is a realized loss of ~21.4% with a stop loss set to 15%. The larger your safety order threshold, the larger your real loss in comparison to your stop loss percentage, and vice versa.
Indicator plots show the calculated bases in white. The closest base below price is yellow. If that base is broken, it turns purple. Once a trade is entered, profit target is shown in silver and stop loss in red.

Carpe Diem [Strategy]Carpe Diem Strategy, a wave cycle strategy that only enters when markets are up trending.
The script uses 3 different trend detection indicators including volume which helps with confirmation.
This script has 10 variations built within it which are fitted for the coins differnt coinditions
The coins included are
BTC/USDT 4H
ETH/USDT 4H
LTC/USDT 4H
ADA/USDT 4H
BNB/USDT 2H
BAND/USDT 4H
BAT/USDT 3H
OGN/USDT 4H
ZIL/USDT 4H
BZRX/USDT 2H
How to use the Indicator
You can change what plots are shown in the settings Cog
When the wave lines are green, the market is up trending and will be looking for a trade whereas when they are red, the market is in a sideways or downtrend.
The buy signal is given by the fast wave either crossing over the slow wave line, or crossing over the value of 25.
The exit signal is when the wave crosses back under the 75 value
This strategy includes Fees and there is NO Repaint. The script is written in version 4
There is an option in the settings cog to choose from 10 Coins and timeframes which the Strategies have been optimised for.
There is also another option in the settings cog to change the backtesting range.
There is also another option to adjust the stop loss. I have left it on the Default value which I believe works best
This strategy performs best on the Binance listings

Bull Call Spread Entry StrategyThis strategy script uses the "Spread Entry Strength" overlay indicator script I designed to show entry timing optimized for an Option Bull
Call Spread.
As for this strategy...
The defaults for the strategy itself are as follows:
Period for strategy: 1/1/18 to 12/1/2021. This can be changed to a different period using the settings.
Condition for entry:
Bull Spread Entry Strength >= "Overlay Signal Strength Level"
Limit entry is used, price must be <= close when signaled
Entry occurs by next day or the order is cancelled
Condition for exit (uses a timed exit):
Bars passed since order entry >= 30 (6 weeks..~42 calendar days)
Thursday (day before "option" expiration date... assuming weekly options exist)
All of the user settings from the overlay are pulled into this for customization purposes. Details of the actual Spread Entry Strength overlay are as follows (copied from my shared indicator):
2 background shadings will occur:
The background will shade blue if the ticker is prime for a Bullish Call spread.
The background will shade purple if the the ticker is prime for a Bearish Put spread.
In theory, if the SE Strength is at one of the extremes of the Bear or Bull side, then a spread is prime for entry.
To calculate this, 8 conditions receive a 1 or zero dependent on whether the condition is true (1) or false (0), and then all of those are summed. The primary gist of the strength comes from Nishant's book, or my interpretation thereof, with some additives that limits what I need to review (such as condition 8 below.)
The 8 Bull Conditions are:
1) Bollinger Bands are outside of the Keltner Channels
2) ADX is trending up
3) RSI is trending up
4) -DI is trending down
5) RSI is under 30
6) Price is below the lower Keltner Channel
7) Price is between the lower Bollinger Band and the Bollinger basis.
8) Price at one point within the last 5 bars was below the lower Bollinger Band
The 8 Bear Conditions are the inverse conditions (except the first):
1) Bollinger Bands are outside of the Keltner Channels
2) ADX is trending down
3) RSI is trending down
4) +DI is trending up
5) RSI is over 70
6) Price is above the upper Keltner Channel
7) Price is between the upper Bollinger Band and the Bollinger basis.
8) Price at one point within the last 5 bars was above the upper Bollinger Band
There is a "market noise" filter that will filter out shading when another market move is considered, i.e. if you don't want to see the potential trade when QQQ moves more than 1% then do the following in the settings:
Check "Market Filter"
Enter QQQ in the "Market Ticker To Use"
Enter 1 in the "Market Too Hot Level"
Press Ok
Obviously, the same holds true for the "Market Too Cool Filter."
Second release notes:
Overlay Signal Strength Level - You can set your own "level" for the overlay in the settings, instead of having to change the script code itself. I have the default set to 6. A lower number shows more overlays, a higher number shows fewer (i.e. more conditions have been met.).
Provide Narrative (Troubleshooting) - Narrative label created with several outputs that will show after the last bar. This narrative needs to be turned on in the settings, as the default is "off" ... unchecked.
Remove Strength Indicator When Squeezed - when checked no overlays will be produced regardless of "scoring." Default is off.
Show Squeezes (Will Override Indicator When Concurrent) - overlays an orange background when the ticker is in a squeeze. I am still working on the accuracy here, but it's usable. This will override the strength indicator as well. This needs to be turned on, if you want it.
Short SMA Period - period used to calculate the short SMA, used in the narrative only, at this point in time.
Medium SMA Period - period used to calculate the medium SMA, used in the narrative only, at this point in time.
Long SMA Period - period used to calculate the medium SMA, used in the narrative only, at this point in time.
Outside of the settings... a few calculation adjustments here and there have occurred and some color shading adjustments to allow for the adjustable level setting.

Noro's ZZ-6 by hamster-botThe original script is available here
New version of ZZ-strategy.
Repaint?
Normal lines are not redrawn. Dotted lines repaint, but do not affect trading (do not affect backtests). You can turn off repaint in the script settings. Repaint (dotted lines) are needed only for clarity. To make it clear from which bar the level is created.
Levels
Lime lines above - level from a local high bar. To open a long position. Using a market stop order.
Red line at the bottom - the level from a local low bar. To open a short position. Using a market stop order.
Trading
You can trade without short positions. Then the red line is the level for a stop-loss order.
Reverse trading can be used. Without stop-loss orders.
Risk size
Order size depends on the risk size parameter and possible loss. If risk size = 2%, it means that the loss will be no more than 2%.
For crypto
Symbols: XBT/USD, BTC /USD, BTC /USDT, ETH/USD, etc - need USD(T)
Timeframes: 1h, 4h, 1d
The script will continue to be developed by the Hamster Bot team

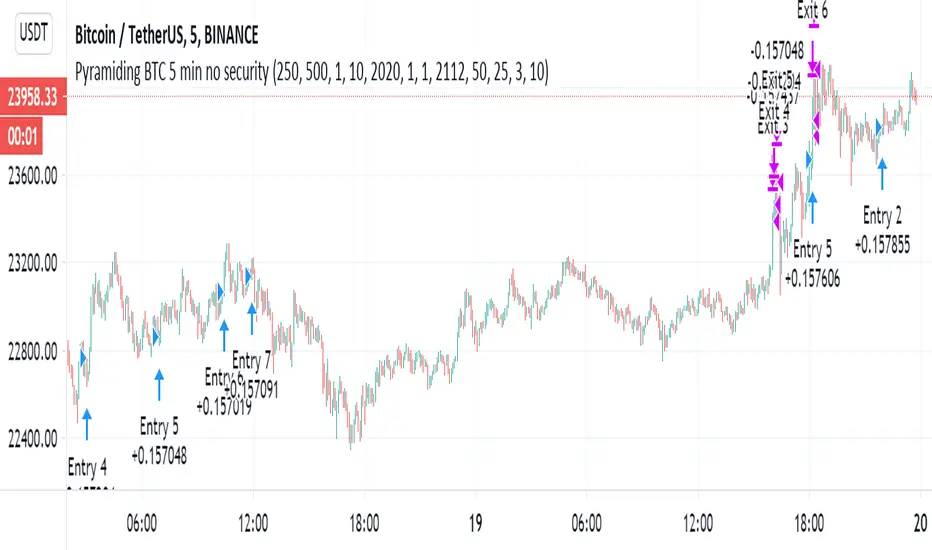
Pyramiding BTC 5 min no securitySince some say that the script with the security is repaint and the results too preety
i decided to run the same script without it. still the best is when security set to 1 min but without the difference not so much.
it just to show the concept of the strategy that based on linear regression cross hull as buy signal
and the the take profit target. so maybe now its also repaint?:)
based